Is our love affair with the car waning?
Peak car (also peak car use or peak travel) is a hypothesis that motor vehicle distance traveled per capita (expressed as VKT vehicle kilometres traveled per person), predominantly by car, has peaked in at least eight major developed countries.
There are two variants of the hypothesis, one (sometimes called 'saturation' or 'plateau') that having reached a peak, car use per head will continue at about the same level indefinitely into the future, the other that after peaking car use may in future show a prolonged declining trend.
Places where it is suggested that car use has peaked include Australia, France, Germany, Iceland, Japan (early 1990s), Sweden, the United Kingdom (many cities from about 1994) and the United States.
Source: http://en.wikipedia.org/wiki/Peak_car
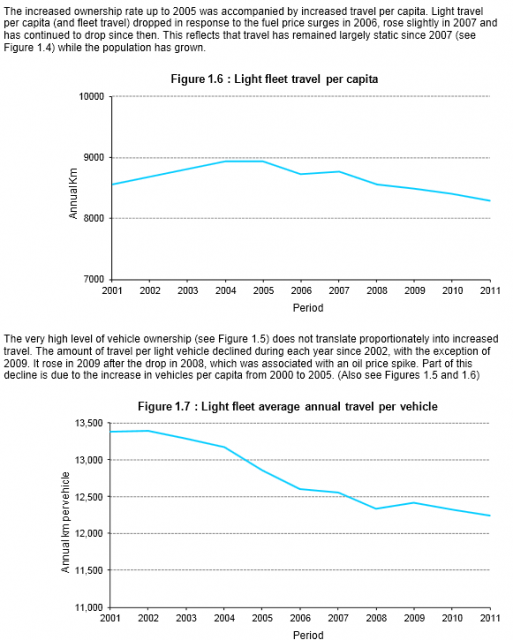
And in New Zealand, according to MoT figures.

Source: http://www.transport.govt.nz/research/Documents/The-NZ-Vehicle-Fleet-201...
| Light ownership per 1000 | Light travel per capita | Light travel per vehicle | Total travel (billions of km) |
2001 | 640.2 | 8564.9 | 13379 | 35.7 |
2002 | 648.6 | 8689.7 | 13397 | 36.7 |
2003 | 662.4 | 8806.0 | 13293 | 37.9 |
2004 | 678.4 | 8939.3 | 13177 | 39.1 |
2005 | 695.0 | 8935.2 | 12856 | 39.5 |
2006 | 692.4 | 8724.5 | 12600 | 39.5 |
2007 | 698.2 | 8767.3 | 12557 | 40.2 |
2008 | 693.8 | 8558.6 | 12335 | 39.7 |
2009 | 683.8 | 8492.9 | 12420 | 39.7 |
2010 | 681.9 | 8407.2 | 12329 | 39.8 |
2011 | 678.7 | 8308.6 | 12242 | 39.8 |
2012 | 682.4 | |||
Change from peak | -2.7% | -7.1% | -8.6% | -1% |
Peak years in bold
Source: http://www.transport.govt.nz/research/Documents/NZ-Vehicle-Fleet-Graphs-2012.xls
# of 15-24yr olds | # of 15-24yr olds w licences | % of 15-24yr olds w driver licence | |
2006 | 610090 | 470650 | 77.1% |
2010 | 641520 | 480004 | 74.8% |
More young people are choosing not to drive.
Sources: MOT driver licence statistics http://www.transport.govt.nz/research/Documents/Licence-2006.pdf http://www.transport.govt.nz/research/Documents/Motor-Vehicle-Crashes-2010-Driver-licence-and-vehicle-fleet-statistics.pdf and Statistics New Zealand population data
New Zealand has an ageing population.
Projections used in future planning of our transport network should take this factor into account, given the lower travel propensity of older people.
A failure to do so is likely to produce excessively high travel projections, overstating the increase in household travel on New Zealand roads between 2006 and 2056 by around 40%
Source: http://www.nzta.govt.nz/resources/nzta-research/docs/nzta-supp-6.pdf
