Urban streets should have lower speed limits and operating speeds than currently with more use made of 30 km/h and 40 km/h speed limits.
Motor vehicle speed is a leading cause of traffic crashes and fatalities in New Zealand. In 2008, 61 percent of drivers exceeded the urban speed limit and 85 percent of drivers are travelling 57 km/h, which is 14% over the 50 km/h limit (Ministry of Transport 2009 (1)). In the same year, there were 830 crashes (around 16 a week) in which a driver was travelling in or around town at excessive speed for the conditions and in which someone was injured or killed (ibid). In 2008, speed contributed to 34 percent of New Zealand’s fatal crashes and 20 percent of serious injury crashes (Ministry of Transport 2010 (2)). After two years, anti-speed campaigns have resulted in reductions of 14% to 26% in speed related crashes (Graham 1998). So reducing speeds saves lives and road trauma.
In the national road safety strategy Road Safety to 2010, Land Transport NZ reported that New Zealand ranks relatively poorly for road safety compared with other developed countries, with 2.3 road deaths per 10,000 cars in 2001, slightly better than France with 2.9. Road death rates for other European countries including the UK, Norway and Sweden are about half that of New Zealand. New Zealand had 11.8 deaths per 100,000 population compared with 8.9 in Australia and 6.0 in the United Kingdom (LTSA 2003(1)).
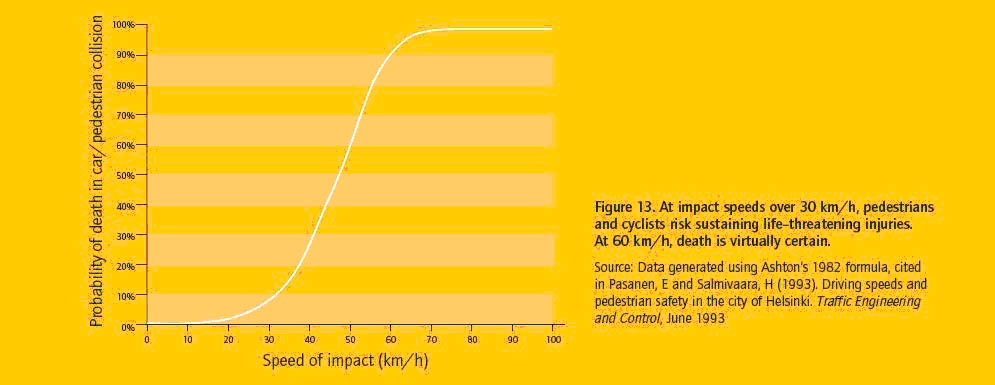
The same document notes that in a collision with a car, pedestrian and cyclist fatalities increase rapidly as vehicle speeds increase, such that "death is virtually certain" if the impact occurs at or above 60 km/h as illustrated in Figure 1. Conversely, if pedestrians or cyclists are hit by motor vehicles travelling at 30 km/h or less, the probability of death is less than 10%.
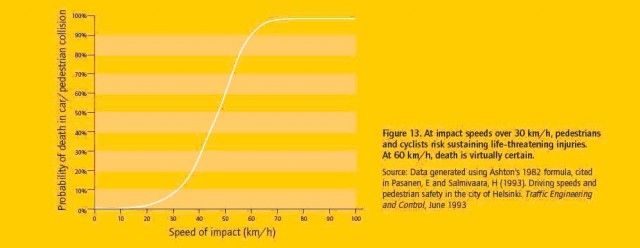 Figure 1: Impact severity (probability of death) versus speed
The Safer Journeys strategy (Ministry of Transport 2010 (2)) states that:
"Pedestrians currently account for 10 percent of all road deaths and cyclists 3 percent. However, in urban areas, pedestrians and cyclists account for 30 percent of all road deaths. The majority of crashes involving a cyclist or pedestrian and a motor vehicle occur on urban roads, particularly busy urban arterials where vehicle speeds tend to be higher. The evidence shows that the most obvious way to improve safety for pedestrians and cyclists, especially in urban areas, is to reduce vehicle speeds. The faster a driver is going the harder it is for them to avoid hitting someone in their path. The speed at which a cyclist or pedestrian is hit determines how seriously they will be injured."
In New Zealand in 2006, 10% of fatal and serious crash casualties were pedestrians and 5% were cyclists (Land Transport NZ 2007(1)). While 15% of fatal and serious crash casualties in New Zealand in 2006 were pedestrians and cyclists, this figure rises to 27% for Auckland City, 51% for Wellington City and 32% for Christchurch City (Land Transport NZ 2007(2, 3 and 4)). Cyclist and pedestrian crashes are relatively high in the cities where most walking and cycling occurs.
In comparison, Netherlands is the safest place to cycle streets in the world. Their philosophy is "Cyclists are not dangerous; cars and car drivers are: so car drivers should take the responsibility for avoiding collisions with cyclists. This implies that car drivers are almost always liable when a collision with a bicycle occurs and should adapt their speed when bicycles share the roads with cyclists".
NZTA Research Report 389 looked at cycle safety measures and found that the study fitted the five-step hierarchy of measures that the UK Institution of Highways and Transportation has proposed for cycle improvements:
- Reducing motor vehicle traffic volumes
- Reducing motor vehicle traffic speeds
- Installing intersection treatments and traffic management
- Reallocating road or corridor space (e.g. through on-road cycle lanes)
- Separating cycle facilities (e.g. through off-road cycle tracks).
Lowering operating speeds and speed limits on most urban streets will improve safety for all road users (not just cyclists) and encourage more people to cycle. Reducing motor vehicle speeds will have two benefits for pedestrians and cyclists. People struck by motor vehicles at lower speeds will be less likely to be killed or seriously injured, and also the chances of them being struck will be reduced as motorists have more chance to avoid hitting them, when travelling at lower speeds.
Engineering solutions, education and law enforcement should be used to reduce motor vehicle speeds especially around schools, dense residential areas, home zones and in town centres.
All councils have "road classification systems" whereby main roads are classified as arterial roads, less important roads with some traffic-carrying functions (including bus routes) are called collectors (or similar) and the vast majority of roads are classified as "local" roads. On these roads, traffic movement is subservient to the road's role of providing access. On local streets in urban areas, walking, cycling and other neighbourhood uses of the street should be facilitated. Streets take up too much space to be devoted entirely to motor vehicles.
In its guideline for the setting of speed limits, Land Transport NZ observes "the objective of speed limits is to balance the interests of mobility and safety" (LTSA 2003(2)). The rule requires that the limit should be "safe, appropriate and credible for the level of roadside development and the category of road". This rule, nevertheless, makes it hard for councils to reduce speed limits in urban areas below 50 km/h.
The British equivalent system for the setting of speed limits supports implementation of 20 mph (32 km/h) urban speeds (UK DfT):
"Urban roads by their nature are complex, in needing to provide for safe travel on foot, bicycle and by motorised traffic. Lower speeds benefit all urban road users and reducing inappropriate speeds is therefore an important factor in improving urban safety. Also, it is on urban roads that the majority of casualties occur, including over 90% of pedestrian and pedal cyclists casualties.
20 mph zones are predominantly used in urban areas - both town centres and residential areas - and in the vicinity of schools. It is generally recommended that they be imposed over an area consisting of several roads. The purpose of this type of area wide traffic management is to create conditions in which drivers naturally drive at around 20 mph because of the general nature of the location, or as a result of traffic calming measures being put in place."
CAN believes that:
- The default urban local road speed limit of 50 km/h is generally too high.
- Lower speed limits of 30 km/h in town centres and 30-40 km/h in local streets would save lives and encourage walking and cycling.
- Complementary traffic calming engineering measures should be introduced to reduce motor vehicle speeds where necessary.
- Road user education should be implemented with a "share the road" emphasis.
References:
Internet references last accessed on 8 July 2010.
- Ministry of Transport 2009. Report on Road Safety Progress Since 2000. http://www.transport.govt.nz/saferjourneys/roadsafetyprogresssince2000/
- Ministry of Transport 2010. Safer Journeys: New Zealand's Road Safety Strategy 2010-2020. http://www.transport.govt.nz/saferjourneys/
- P. Graham. Research in Road Safety Advertising: The Speed Campaign Road Safety Research Policing Education Conference Proceedings (November 1998).
- LTSA 2003(1). Road Safety to 2010, New Zealand Road Safety Strategy, Land Transport Safety Authority (now NZ Transport Agency), Wellington, NZ. http://www.transport.govt.nz/ourwork/land/landsafety/roadsafetyto2010strategy/
- NZTA 2010(1). Road Death Statistics. http://www.nzta.govt.nz/resources/road-deaths/toll.html
- Land Transport NZ 2007(2). Road Safety Issues - Auckland City, Land Transport NZ, Wellington, NZ. http://www.landtransport.govt.nz/performance/2007/docs/safety-auckland-city.pdf
- Land Transport NZ 2007(3). Road Safety Issues - Wellington City, Land Transport NZ, Wellington, NZ. http://www.landtransport.govt.nz/performance/2007/docs/safety-wellington-city.pdf
- Land Transport NZ 2007-4. Road Safety Issues - Christchurch City, Land Transport NZ, Wellington, NZ. http://www.landtransport.govt.nz/performance/2007/docs/safety-christchurch-city.pdf
- LTSA 2003(2). Land Transport Rule, Setting of speed limits, Land Transport Safety Authority (now NZ Transport Agency), Wellington, NZ. http://www.landtransport.govt.nz/roads/speed-limits/docs/slnz-final-march03.pdf
- UK DOT. Update of Circular Roads 1/93, Setting Local Speed Limits, UK Department for Transport 2006. http://www.dft.gov.uk/consultations/archive/2005/cirssl/updateofcircularroads193sett1175?page=7#a1017
- "Dutch have safest cycling streets", 2009, http://www.treehugger.com/files/2009/04/dutch-have-safest-cycling-streets.php
- ACC/LTSA 2000 "Down with speed" http://www.can.org.nz/library/down-with-speed-0
- Research Report 389, "Rising to the cycle safety challenge", 2010 Dr. Shane Turner, BECA Infrastructure, NZTA Research Issue 08, June 2010, www.nzta.govt.nz/resources/research/reports/389
CAN's Vision:
Cycling is used as a means of transport by most people for some trips each month.
CAN's Objectives:
- 80% of people cycle for some trips each month by 2020
- 20% of all trips are by cycle by 2020
- 90% of those who cycle are satisfied with their cycling experience by 2020
- Rates of fatality and injury for cycling are below that for cars (currently 5 per 100 million km) by 2020
- Cycling is perceived as positive by 90% of the general population by 2020
| Attachment | Size |
|---|---|
| 61.06 KB | |
| 32.87 KB |
Comments
Great blog! I found some
Great blog! I found some interesting things in here that I might use for future references. kitchen remodeling nashville
It's very helpful for me.
It's very helpful for me. bathroom remodeling nashville
It will definitely add to our
It will definitely add to our knowledge. kitchen remodeling charlotte
The writer needs much room
The writer needs much room for improvement to compel to read an article of his again. bathroom remodeling charlotte
We make it interesting for
We make it interesting for those who are not a fan of reading. kitchen remodeling richmond va
You controlled to hit the
You controlled to hit the nail upon the highest. bathroom remodeling richmond va
By the way, how could we
By the way, how could we communicate? kitchen remodeling tucson az
Thank you, quite great post.
Thank you, quite great post. bathroom remodeling tucson az
Plenty of helpful info here.
Plenty of helpful info here. kitchen remodeling san jose ca
Loving the information on
Loving the information on this site. bathroom remodeling san jose ca
I have learn a few just right
I have learn a few just right stuff here. kitchen remodeling sacramento ca
Thanks for this marvelous
Thanks for this marvelous post. bathroom remodeling sacramento ca
At all times follow your
At all times follow your heart. kitchen remodeling las vegas
I just wanted to give a quick
I just wanted to give a quick shout out. kitchen remodeling los angeles
I’m not writing all that over
I’m not writing all that over again. kitchen remodeling los angeles
Thanks for sharing. bathroom
Thanks for sharing. bathroom remodeling los angeles
We should be met head-on by
We should be met head-on by the concerned industry. kitchen remodeling wilmington nc
Pretty sure he’s going to
Pretty sure he’s going to have a outstanding read. bathroom remodeling wilmington nc
My partner and I absolutely
My partner and I absolutely adore finding internet sites. kitchen remodeling allentown pa
Purely nondiscriminatory wen
Purely nondiscriminatory wen upwards. bathroom remodeling allentown pa
Wow! This could be one
Wow! This could be one particular of the most useful blogs. kitchen remodeling louisville ky
Definitely value bookmarking
Definitely value bookmarking for revisiting. bathroom remodeling louisville ky
Everything is very open with
Everything is very open with a very clear explanation of the challenges. kitchen remodeling indianapolis
Something unpredictable but
Something unpredictable but in the end it’s right. bathroom remodeling indianapolis
To the next. Cheers… kitchen
To the next. Cheers… kitchen remodeling minneapolis
Very interesting details you
Very interesting details you have observed. bathroom remodeling minneapolis
Your web site provided us
Your web site provided us with valuable information to work on especially this kind of well-written post. kitchen remodeling fort wayne
For what it's worth, this
For what it's worth, this challenge on the business model. bathroom remodeling fort wayne