Cycling to work
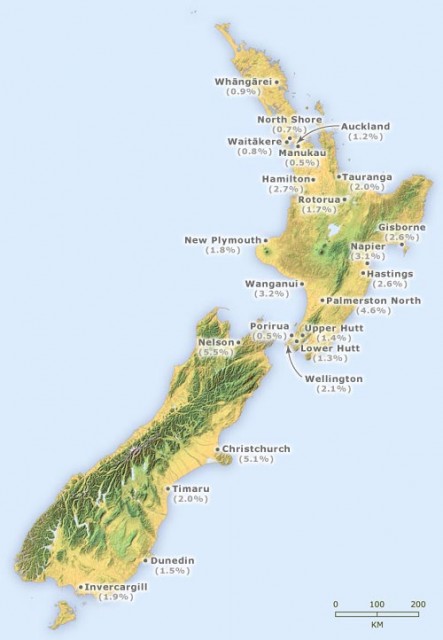
This map shows the percentage of people who biked to work in various New Zealand cities on Census Day, 2006. Nelson (5.5%), Christchurch (5.1%) and Palmerston North (4.6%) had much higher percentages of bike riders per population than other cities.
Tags:
| Attachment | Size |
|---|---|
| 75.5 KB | |
| 223 KB |
Comments
One of the problems with
One of the problems with "official" statistics is that they also include all the people who either (a) work at home, (b) did not go to work that day, or (c) for some reason did not record a mode travelled. These groups make up approximately 25% of the total respondents, and there is no reason to think a certain proportion of them wouldn't have cycled to work if they had the opportunity. Therefore if you are trying to determine the proportion of COMMUTERS who cycled, the official stats will significantly underestimate them.
For example:
- According to the data, 5.5% of Nelson RESIDENTS cycled to work on Census day, but
- Of the people who commuted to work that day, 7.2% of Nelson COMMUTERS cycled to work.
As you can see, that makes quite a difference to the case (which is pretty important when you are dealing with small proportions!).
The attached spreadsheets give the relevant data for all districts around the country and also going back to 1981/1986.
The other thing to remember is that trips to work and back again only make up ~20% of all personal trips. So the Census data can only tell you so much (e.g. it tells you nothing about trips for education). Have a look at the NZ Household Travel Survey for more information on trips in general.